Method
Every number on this site, and where it came from
This page exists because the honest version of a face score is the one you can audit. Below is the whole arithmetic - the inputs, the weights, the reference data behind the percentile claims, and the specific things the result cannot support.
Updated August 28, 2026
Want your own numbers? Take the free test - in your browser, nothing uploaded.
What the tool can see
A landmark model - Google's MediaPipe Face Landmarker, described in Kartynnik et al. (2019) - is downloaded into your browser and run against your photo. It returns 478 points, each one a position expressed as a fraction of the image width and height. That set of coordinates is the entire input. The tool has no access to skin tone, hair, makeup, image quality or expression, and it does not read them indirectly - a point is a pair of numbers, and numbers are all that reach the arithmetic.
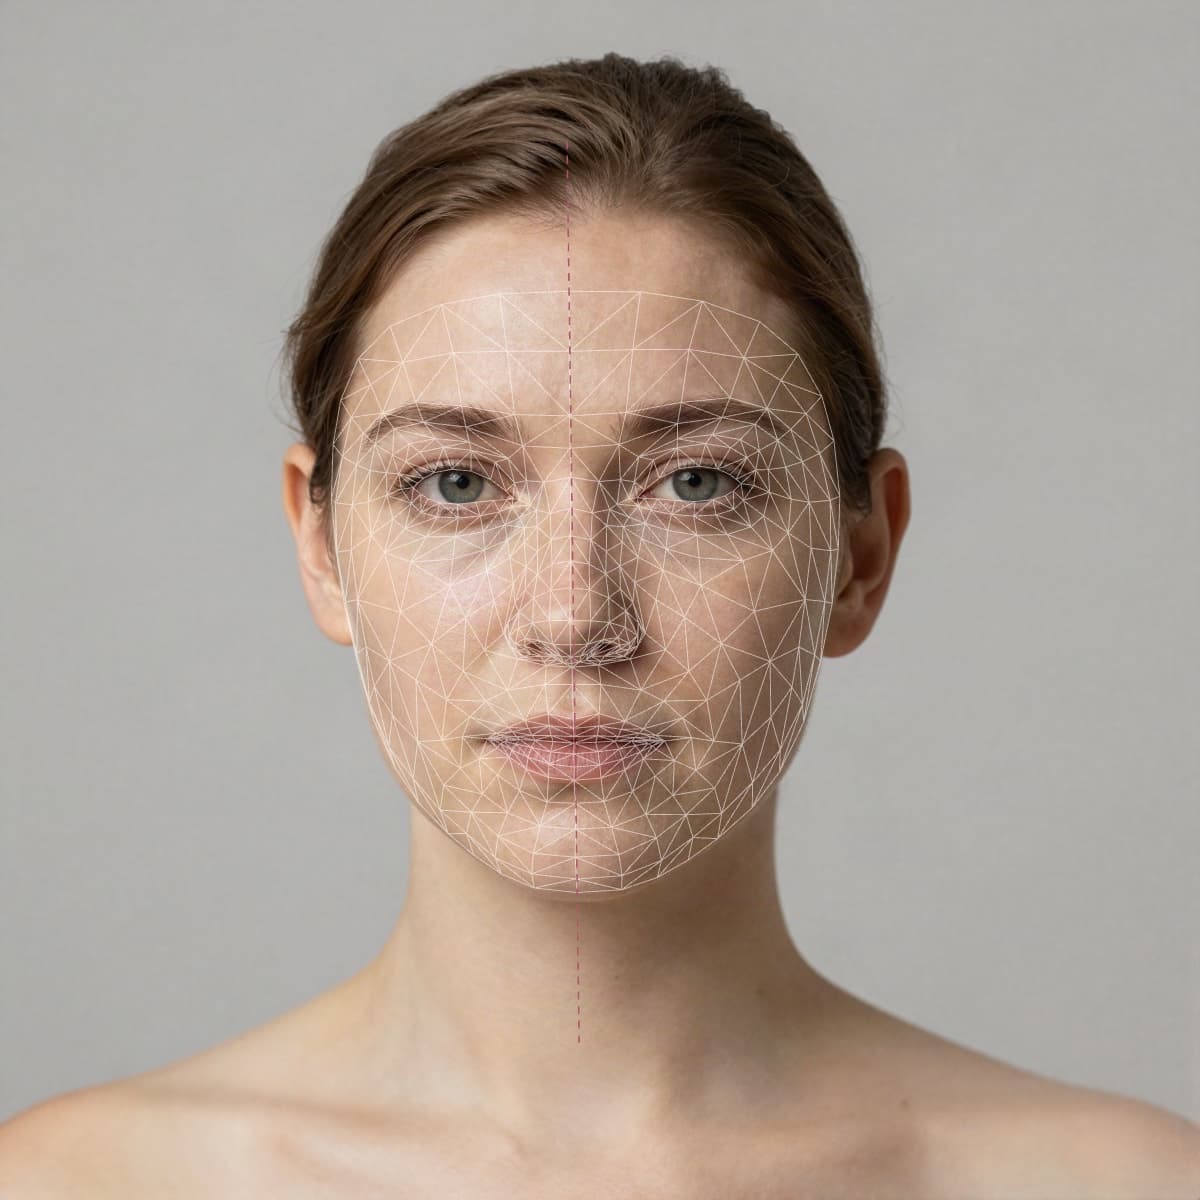
The model needs WebGL and there is no fallback without it - the landmark graph builds its image nodes on the GPU even when the CPU delegate is selected. The tool checks for WebGL up front and says so plainly when it is missing, instead of failing at you with an internal error.
Your photo is never transmitted by the test. No request carries it. The only path on the site that sends a photo anywhere is the optional paid report, which asks first and says exactly where it goes.
The photo is measured, not you
Before any score is produced, the tilt and turn of your head are estimated from the cheekbone and midline points. This happens first for a reason: a rotated head foreshortens one side of the face in the image, and no amount of care further down the pipeline can recover what the camera flattened.
The tolerance for looking up and down is deliberately lopsided, because the typical selfie is taken from slightly above: 25° of chin-down is accepted against 18° of chin-up. Past 10° of turn or 12° of tilt you get a warning on the result rather than a quietly compromised number.
Comparing your face to itself
The symmetry pass is the only part of the tool that compares you to nothing but yourself, which is why it carries the most weight. Each paired feature is reflected across the facial midline and the mismatch is measured as a percentage of face width.
That raw deviation is not penalised linearly. A straight "subtract five points per percent" rule scores ordinary landmark noise as though it were severe asymmetry, and in practice it pushed roughly a third of all faces into the bottom band on jaw measurements alone. Instead each feature has its own curve, anchored so that a typical face lands around 72 and only genuine outliers fall below 25. Features get separate curves because they are not equally noisy - jaw landmarks move around the most, nose landmarks the least.
The pairs then combine like this:
| Feature pair | Share | Against the nose |
|---|---|---|
| jaw | 35% | 3.5x |
| eye | 25% | 2.5x |
| eyebrow | 15% | 1.5x |
| mouth | 15% | 1.5x |
| nose | 10% | 1.0x |
The jaw dominates because it is the pair a viewer registers first. The nose is weighted lightest because it varies least between people, so it separates faces poorly.
Comparing your face to a tradition
The other three inputs work differently, and it is worth being clear about how. They do not measure your face against itself - they measure it against target values inherited from classical proportion theory. Facial thirds want an even split from hairline to brow to nose to chin. Facial fifths want the face width to divide into five eye-widths. The golden ratio wants height against width near 1.618.
Those targets are conventions, not laws, and they come from one aesthetic tradition rather than from human biology. When Farkas and colleagues measured real faces against the neoclassical canons in 1985, most faces did not fit them. That is the honest reason the golden ratio carries the smallest weight of the four at 15%: of everything here it is the most inherited and the least defensible as a universal standard - see Holland (2008) on the pitfalls of the phi mask and Pallett, Link and Lee (2010), who found the ratios raters actually preferred were not 1.618.
The four then combine into the score you see. Symmetry takes 35% of it. The two balance measures - thirds and fifths - take 25% each, so between them they account for half the total. The golden ratio takes the remaining 15%.
Where the percentile claims come from
When the result says your fifths are higher than 75% of faces measured, that is a claim about a specific dataset, and you should be able to interrogate it. The dataset is a table of 7,997 previously measured faces, stored as one score per percentile per metric and shipped with the site rather than fetched from anywhere.
Reading a table like that has a trap in it that is worth explaining, because most tools fall into it. Scores plateau: many percentiles share the same whole number. If a score of 82 covers everything from the 82nd to the 89th percentile, then quoting the top of that plateau makes the claim false for everyone sitting at the bottom of it. So each band here is set to the lowest score whose entire plateau clears the figure it advertises.
| Band | From | Claim it carries |
|---|---|---|
| Classical | 86 | Higher than 95% of faces measured |
| Harmonious | 83 | Higher than 85% of faces measured |
| Balanced | 79 | Higher than 65% of faces measured |
A test in the codebase recomputes those minimums from the table on every build and fails if either side moves, so a future change to the scoring cannot quietly leave a false claim on the page. The two lowest bands carry no percentile at all, and no claim is shown for any sub-score below the 55th percentile.
For reference, the middle of that distribution sits at 74. Half of all measured faces fall between 65 and 80.
Five things this cannot tell you
- Whether anyone finds you pretty. Geometry is a modest predictor of how people rate faces (the review to read is Rhodes, 2006), and most of the variation in any individual's judgement is specific to them. That gap is a fact about people, not a gap in the code.
- Anything about depth. One front-facing photograph carries almost no information about projection, profile or how a face reads in three dimensions.
- Whether the targets suit your face. Three of the four inputs score you against one aesthetic tradition. Differing from it is not a defect.
- How you compare to everyone. The reference table comes from people who chose to scan their own face, which is not a random sample of humanity.
- Anything you should act on. There is nothing sold here, no procedure suggested and no improvement plan, because a four percent symmetry deviation is not a problem waiting for a solution.
Questions people ask
- Q:How pretty am I - how is that number worked out?
- It is a weighted average of four geometric measurements, each scored 0-100 first. Symmetry carries 35%, facial thirds 25%, facial fifths 25% and the golden ratio 15%. Every input comes from the positions of 478 points the landmark model finds on your face. Nothing about colour, skin, hair or expression enters the calculation at any stage.
- Q:Where do the 'higher than N%' claims come from?
- From a committed table of 7,997 previously measured faces, stored as one score per percentile per metric and shipped with the site rather than fetched. Your score is looked up against that table. Two constraints keep it honest: the claim is capped so nobody is told they beat everyone, and it is suppressed entirely below the 55th percentile, because a rank is useful information at the top and only discouraging at the bottom.
- Q:Is the score out of 10?
- No, and that is deliberate. A mark out of ten is the format every face-rating site uses, and it reads as a rating of a person rather than a measurement of a photograph. The score here is out of 100 and it is labelled facial harmony, which is the thing that was actually measured.
- Q:Why does the test ask me to retake the photo sometimes?
- Because head rotation is the largest single source of false low scores, and most people cannot see it in their own photo. Turning your head compresses one side of your face in the image, and the symmetry pass has no way to tell that apart from real asymmetry. Pose is estimated before anything is scored, and the result is flagged beyond 10° of yaw or 12° of roll.
- Q:Does this use AI?
- Only to find the points. A convolutional model locates the landmarks on your face, and that step is machine learning. Everything after it is ordinary arithmetic you could redo on paper: distances, ratios, weighted sums and a lookup against a table. No language model, no generative model and no black box produces the score.
- Q:Is the proportion scoring culturally neutral?
- No, and no ratio-based face test is. Facial thirds, facial fifths and the golden ratio all descend from one European aesthetic tradition, and what counts as ideal spacing genuinely differs across populations. A lower proportion sub-score frequently means your face differs from that tradition rather than that anything is out of balance. Symmetry is free of this problem, because it only ever compares your face to itself.
See the measurements on your own photo
Free, no account. The measurement runs inside your browser and the photo never leaves your device.